FS-Offat-Spec is a series of program modules that interface with FS2000 for the spectral fatigue analysis of framed structures under cyclic loading due to the action of hydrodynamic waves.
Outline Procedure
- FS-Wave - WaveLoader steps a characteristic wave through the structure
- The drag and inertia components of load are processed to obtain equivalent harmonic nodal loading
- FS2000's Dynamic Response Module is used to obtain the dynamic response to the harmonic loads
- SCF Evaluation - SCFs evaluated at up to 12 circumferential locations (stress points) on brace and chord side
- Stress Range - Peak stress range evaluated at all stress points for the stepped wave (employs static improvement technique)
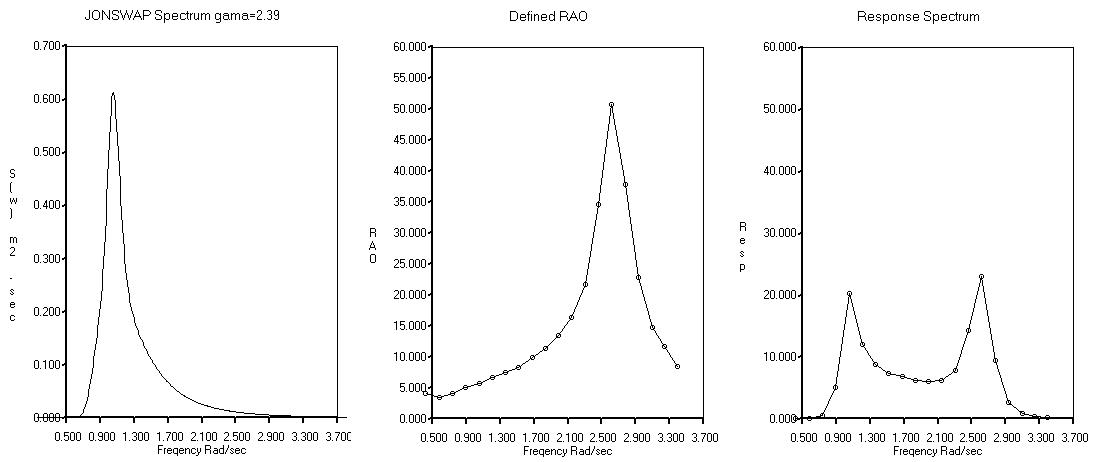
- Transfer Functions - Stress range transfer function created by using waves with different wave periods
- Wave amplitude spectrums used to describe a random seastate eg JONSWAP
- Spectral Stress Response Spectra obtained from transfer functions and seastate spectra
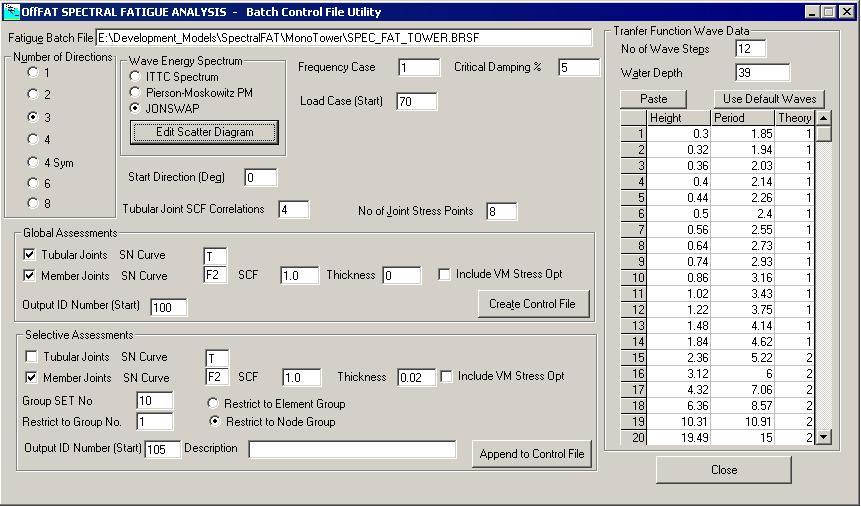
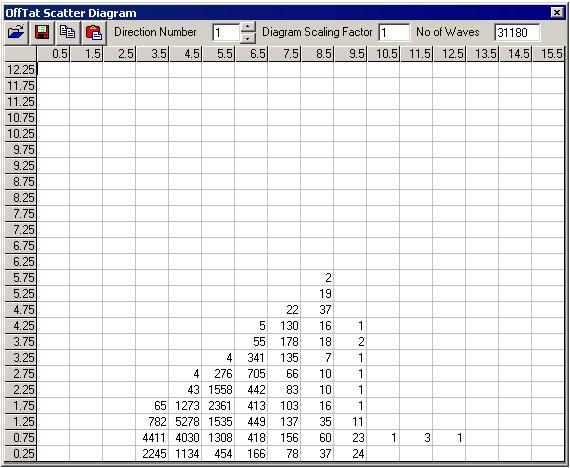
- Scatter Diagram- Directional wave exceedence data defined by user specified scatter diagram
- SN Curves - Standard SN curves or user defined curves are used in conjunction with Miners Rule to evaluate damage ratios
Simple Operation
All Modules run in batch mode. A control file utility program creates all load cases and control files used in the fatigue analysis.
- Joint Recognition - Automatic recognition of Chord and Brace members
- Classification - Automatic Joint Classification (T/Y, K, X etc) based on geometry. Gap evaluation for K joints.
- Non-Tubular Joints - Stress ranges at standard nodes using defined SCF.
- SCF Evaluation Utility - Automatic SCF evaluation based on program evaluated parameters and SCF category. Evaluation utility for sensitivity studies on SCF parameters.
- UEG · Kuang, Wordsworth/Smedley
- DEn Guidance Notes
- DNV/API/EC3/ISO 1434 Ethymiou Parametric Equations
- User Defined Re-Classification
All program evaluated parameters including SCFs may be re-defined using user defined classifications and parameters.
- SN Curves - Standard or user defined curves.
Selective Output
- Graphical - Damage Ratio Plots Selective plots - Show only low lives
- Sorted Summary - Sort by Life Rating
- Restricted Output- Limit Output to Defined Criticality Limit (Life threshold)